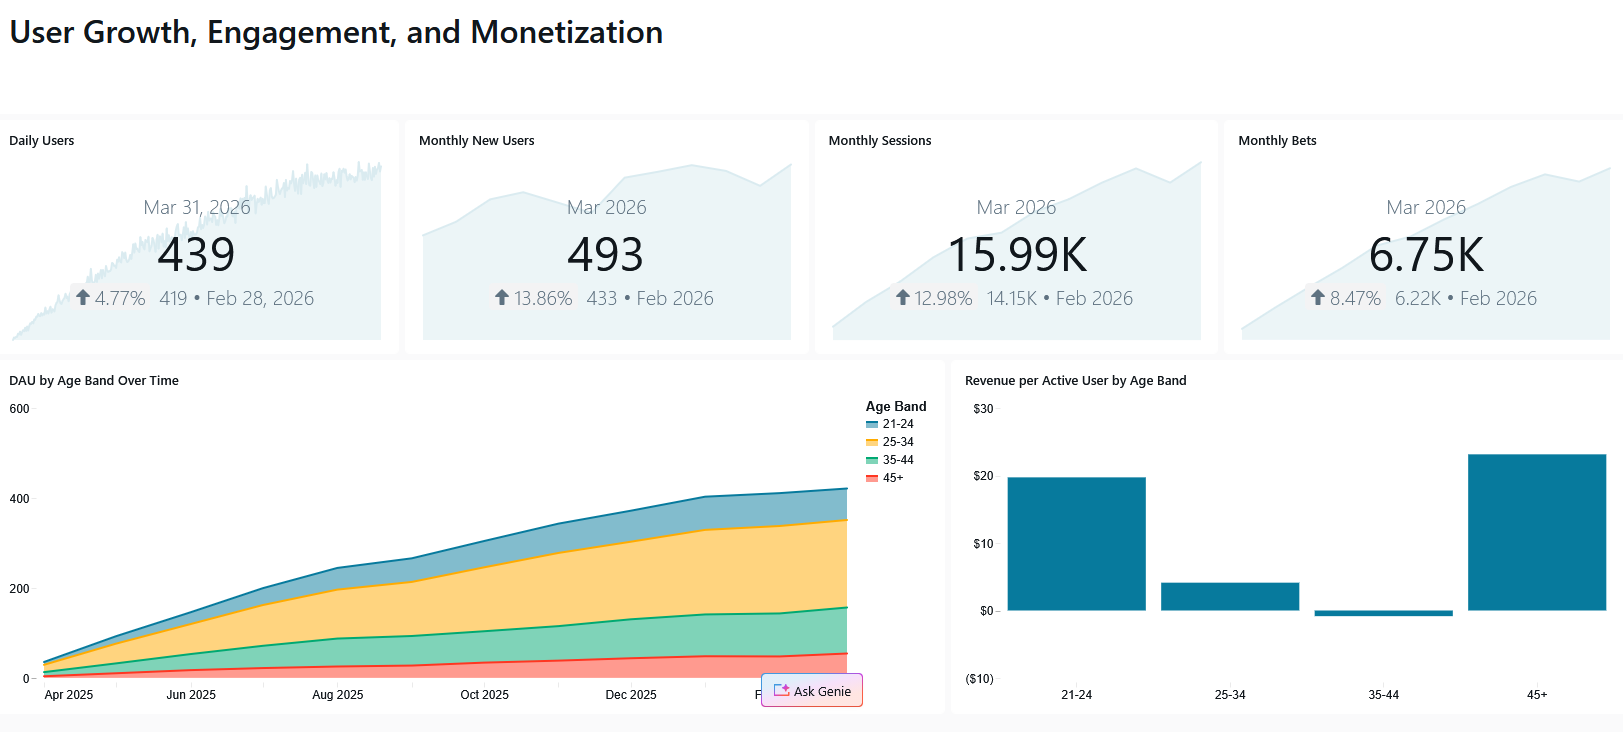
Product Analytics Dashboard (Databricks)
This project simulates a product analytics use case for a social betting platform, focusing on user growth, engagement, and monetization using Databricks SQL and AI/BI dashboards.
- Generated synthetic behavioral data (users, sessions, bets, promotions) to model realistic platform activity
- Designed a data model with daily and user-level metric tables to support time-series and segmentation analysis
- Built SQL transformations to calculate KPIs including DAU, new users, sessions, bets, conversion, and revenue per active user
- Developed a dashboard in Databricks to track performance trends and segment behavior by user demographics
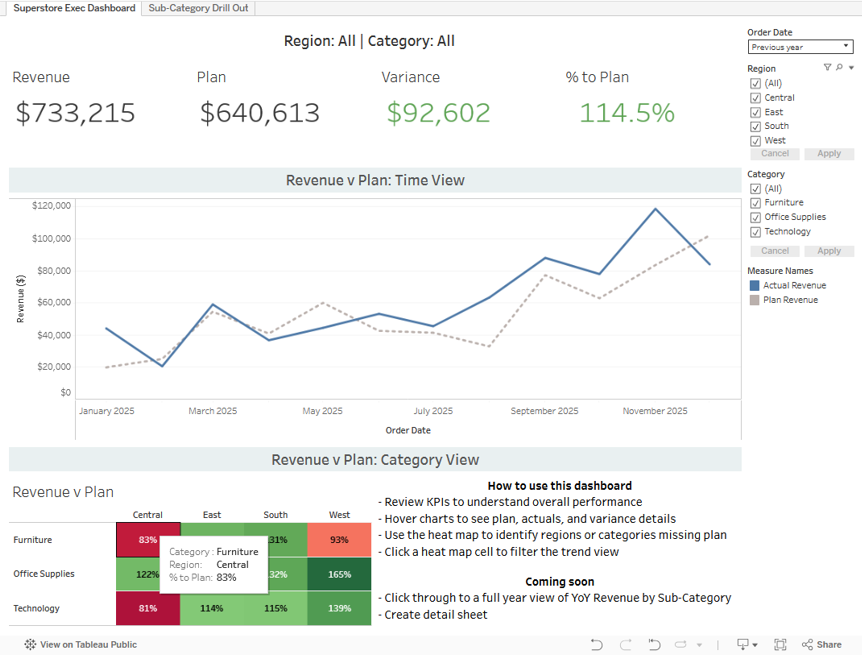
Retail Performance & Plan vs Actual Analysis (Superstore)
This project uses the Superstore dataset to simulate a real-world retail performance analytics use case, with a focus on plan vs actual revenue tracking, trend analysis, and actionable insights for business stakeholders.
- Aggregated transactional order data into monthly actuals across category and region
- Created a revenue plan dataset using year-over-year growth assumptions
- Built an executive-level Tableau dashboard to track KPIs, revenue vs plan trends, and performance variance
- Designed interactive graphs and charts to identify where revenue misses occur
- Developed a detailed sub-category analysis view to explore whether underperformance was driven by volume, order behavior, or both
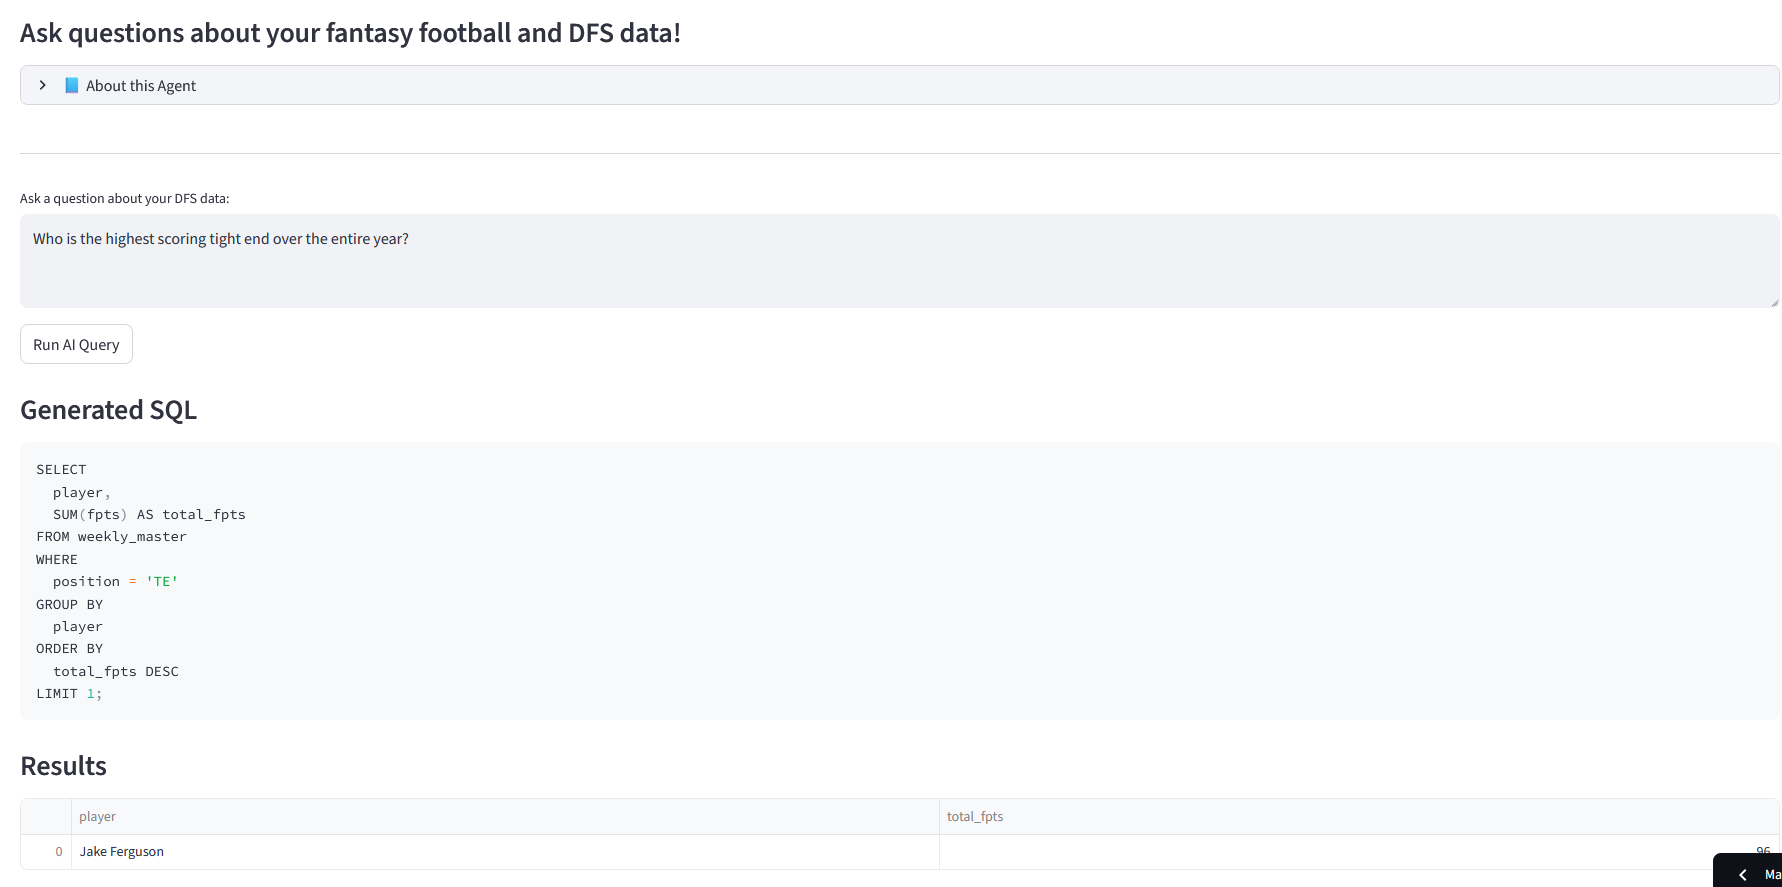
DFS AI Agent
This Streamlit app allows users to turn natural lanuage questions about fantasy football into query results.
- User types a question into the interface
- The Gemini API is used to convert this into a SQL query
- The query is passed to a PostgreSQL DB of fantasy and DFS data
- The query and table of results are passed back to the Streamlit UI
Fantasy Football Draft Tool
This project involved creating a draft tool in Google Sheets connected to ESPN live drafts.
- Complete ETL process
- Scrape daily ADP data from ESPN with Selenium in Python
- Live scrape picks from ESPN drafts with Selenium in Python
- Upload data to Google Sheets with Python
- Creation of a dashboard Google Sheets
League of Legends (LoL) Data
This project explored match data for the first 14 minutes of ranked games in Gold elo on patch 12.5. This involved the following.
- Use RIOT games API to gather match data
- Process and clean the match data
- Run an exploratory analysis to find trends
- Apply logistic regression to attempt to predict the winning team

Customer Demographics and Segmentation
This project explored the following for a fictional customer data set.
- Customer Demographics
- Market Segmentation
- Effectiveness of Marketing Campaigns
Statistics Teaching Applets
This site hosts a collection of statistics applets used in teaching introduction to statistics.
- Random Number Generator
- Survey Sampler
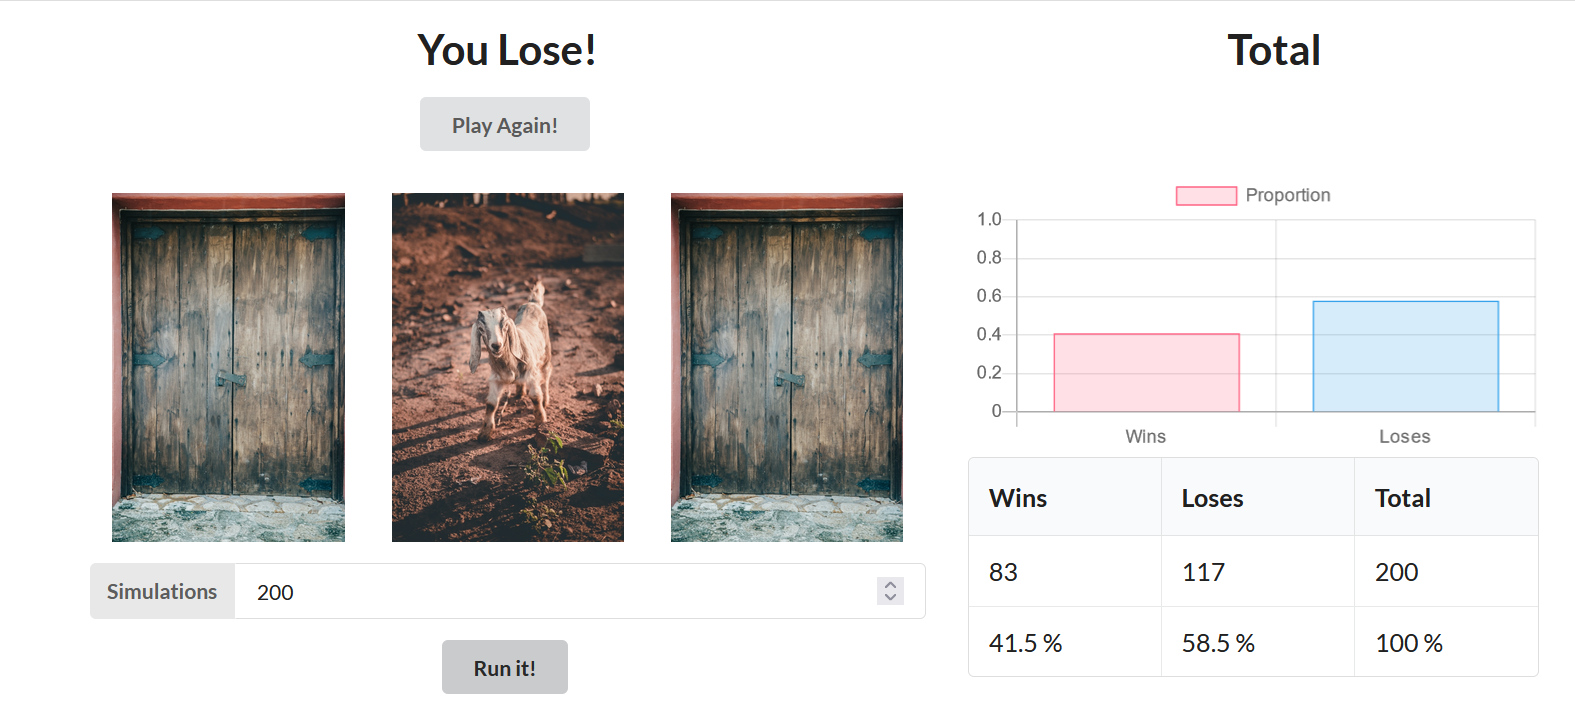
- Monte Carlo - Cars and Goats
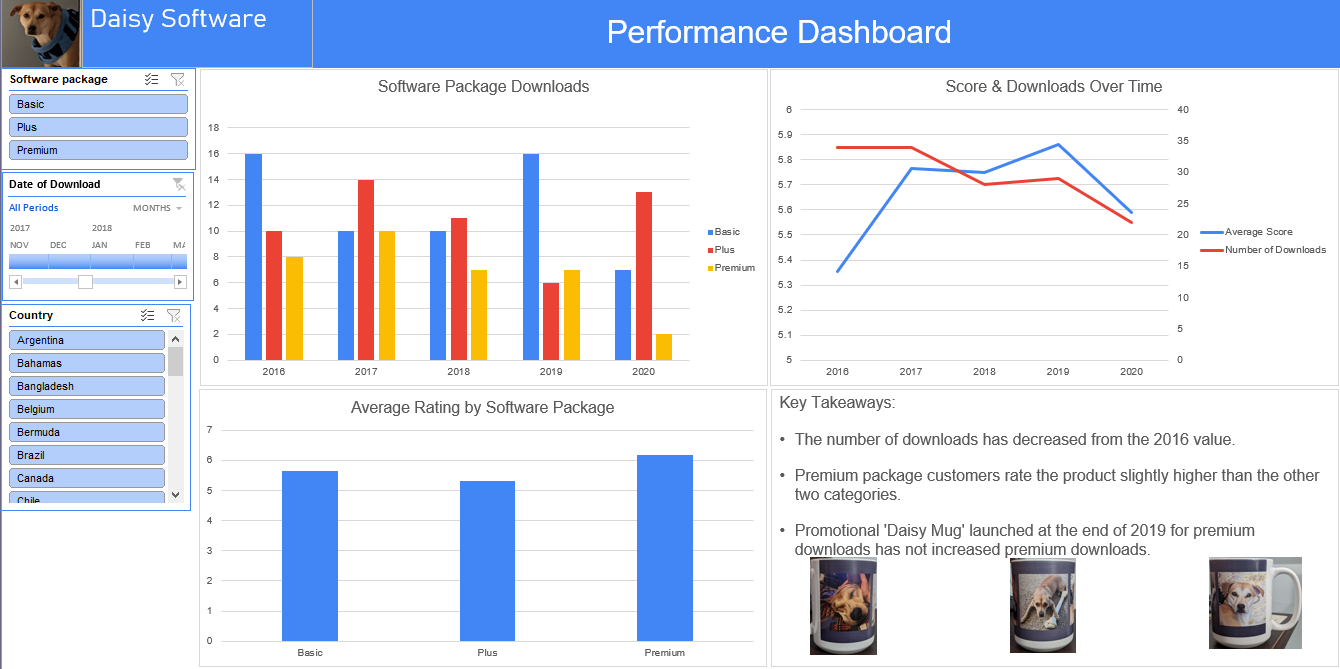
Excel Performance Dashboard
This project explored fictional survey data from a software company. In this I used the following technologies.
- Pivot Tables
- Filters
- Numerous Charts