Goal
For this project, I wanted to both learn the Databricks platform and explore the types of metrics that drive business growth for a betting product.
What Should We Measure?
After researching common product and marketing analytics metrics, I focused the first phase of the project on four key areas:
- Growth -> new users
- Engagement -> daily active users (DAU), sessions, bets
- Monetization -> revenue, revenue per active user
- Behavior -> conversion (users placing at least one bet)
The goal was to create a simple but meaningful foundation that could be expanded later.
Getting the Data
Since real product data wasn't available, I used ChatGPT + Codex to generate synthetic data tailored to a betting application.
The dataset was designed to support both this phase and future analysis, and includes:
- users
- sessions
- bets
- promotions
- in-app/social events
- marketing spend
The focus was on creating realistic relationships between user activity, conversion, and revenue rather than perfectly modeling real-world distributions.
Data Modeling
After loading the raw tables into Databricks, I built two primary analytics tables:
daily_metrics
A time-series table used to track trends in:
- DAU
- sessions
- bets
- revenue (defined as stake - payout)
- new users
user_metrics
A user-level table used to analyze:
- signup behavior
- acquisition channel
- conversion (first bet)
- total sessions, bets, and revenue
A key focus here was aligning data to the correct grain:
- daily metrics for time-based trends
- user metrics for segmentation and behavioral analysis
This approach also avoids common issues like join duplication and makes downstream analysis much simpler.
Building the Dashboard
I kept the dashboard intentionally simple and focused.
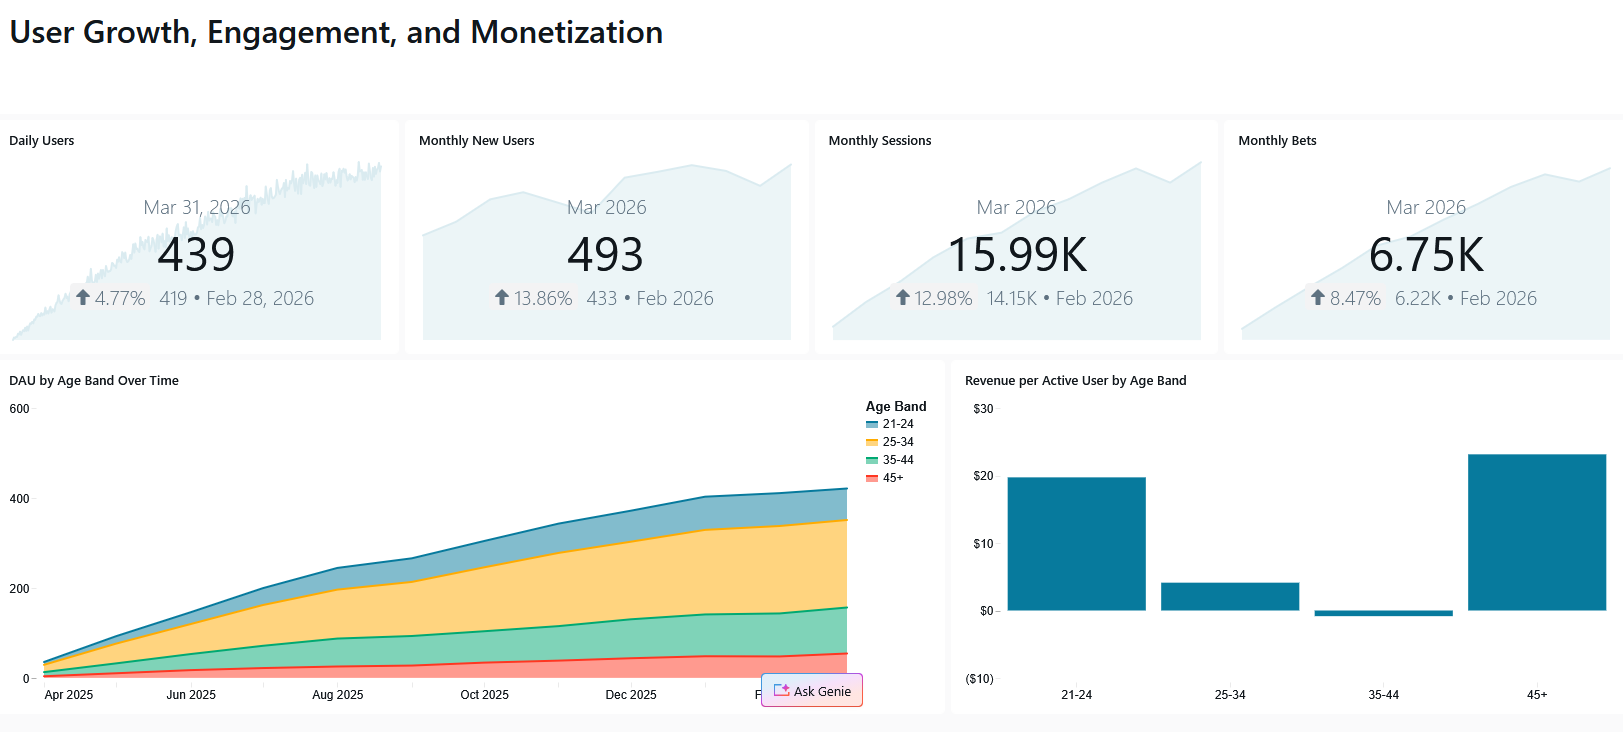
At the top:
- DAU
- New Users
- Sessions
- Bets
These provide a quick snapshot of platform growth and activity.
Below, I added two charts segmented by age band (21-24, 25-34, 35-44, 45+):
- DAU by Age Band (trend + composition)
- Revenue per Active User by Age Band
This pairing allows for a clear comparison between:
- who is driving engagement
- who is driving monetization
The dashboard was built using Databricks AI/BI dashboards, which made it easy to quickly create and iterate on visualizations.
Quick Insights
A few interesting patterns stood out:
- Growth is steady across DAU, new users, sessions, and bets
- The 25-34 segment drives the majority of engagement
- However, revenue per active user is highest among 21-24 and 45+ users
- The 35-44 segment shows slightly negative revenue, suggesting we have some serious sharks from 35-44!
This highlights a common product dynamic:
high engagement does not always translate to high monetization
What's Next?
The next phase of this project will focus on promotional strategy and marketing efficiency, including:
- cost per acquisition (CPA)
- customer acquisition cost (CAC)
- promo ROI
- retention impacts
The goal is to better understand how acquisition and incentive strategies influence long-term user value.
See you in Part 2!